This is part one of a two-part series where we’ll get a high-level overview of a chocolate dataset and prepare it for a predictive model. It will be just as much about exploring chocolate as it is about cleaning and conditioning data, so if you also have a sweet tooth, I hope you’ll find this to be a treat.
=======
Anyone who knows me knows I’m a chocoholic. Every October, I get a serious stash of chocolates, courtesy of friends and family who indulge me for my birthday. While munching on a piece of dark chocolate with banana bits a few nights ago, I wondered whether there was a chocolate dataset with ratings available. I doubted it. How can something as subjective as chocolate preferences be summarized into a dataset? A quick google search later, I was happy to see that there was one available via Kaggle. The data was a bit dated and I wanted the latest, but I couldn’t figure out how to web scrape it from the source directly with R’s rvest package. I decided that this would be the time to pick up the Python programming language, known to have better web scraping capabilities than R. After scraping the dataset into a CSV file, I figured, “Why stop there? I want a machine learning system that will tell me which chocolates will receive the high ratings.” Hence, this. See what happens when you give me some chocolate? I’m going to ask for a predictive chocolate rating algorithm.
Before any actual model building to solve this “problem” can happen, we have to understand the data. We’ll do just that in Part One through data preparation tasks. But this involves more than just converting data types, transforming data fields, aggregating values, and moving data around. There’s high-level thinking that goes on behind every choice and it helps to understand the nuances of and domain knowledge behind the data. It’s at this earlier stage where getting that high-level overview allows us to see how the chocolate dataset is capable of or even relevant to solving the problem. Then can we better develop a problem framework that provides a useful direction for us in building a model for Part Two.
Bittersweet Exploration through Data Preparation
We’ll get to know the dataset by going through each variable one by one. The tasks in mind for Part One are three-fold: 1) learn about chocolates; 2) clean and condition the data to fit into a supervised learning algorithm; and 3) formulate a problem framework.
About the dataset
The data is from flavorsofcacao.com and compiled by the Manhattan Chocolate Society, a group of members that has organized nearly 70 chocolate tasting events for themselves since 2007. The focus is on plain dark craft/fine chocolates and includes over 19,000 different ones. According to the website and review guide, each chocolate’s quality rating is evaluated from a combination of both objective qualities (e.g., flavor, texture, and aftermelt) and subjective interpretation including impressions on flavor development, character, and style.
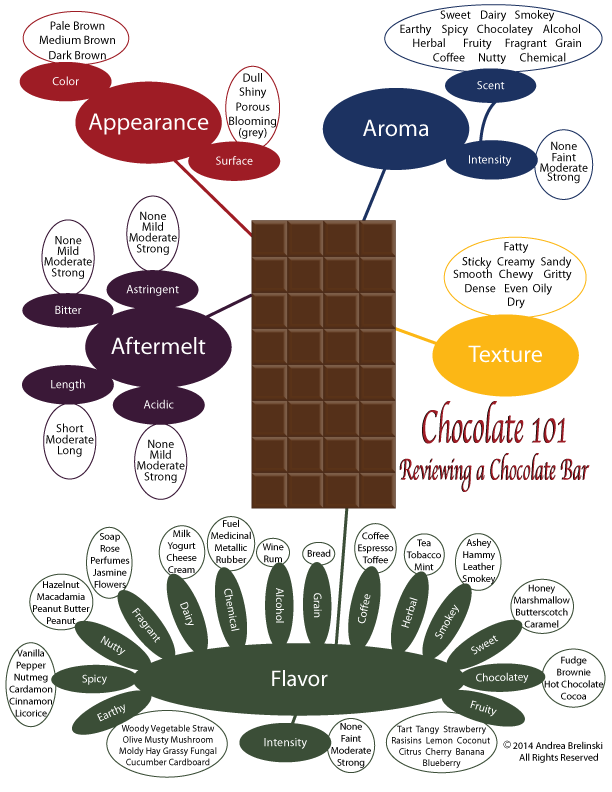
Here’s their rating system, which ranges from 1 through 5 with increments of 0.25 in between to allow for variation:
- 5 = Elite (Transcending beyond the ordinary limits)
- 4 = Premium (Superior flavor development, character and style)
- 3 = Satisfactory (3.0) to praiseworthy (3.75) (well made with special qualities)
- 2 = Disappointing (Passable but contains at least one significant flaw)
- 1 = Unpleasant (mostly unpalatable)
Looking ahead, of interest will be predicting those rated at 3.75 or higher. Aside from quality ratings, there’s information on the company names and their country locations; the origins and types of the cacao bean the chocolates are made from; the percent of cocoa in the ingredients; and the year they were rated.
Preliminaries
The first thing is to import the Python modules needed for reading, processing, and visualizing the data. The scraped dataset is stored in this Github repo, so we’ll bring it in from there and get information about its structure.
import pandas as pd
pd.set_option('display.expand_frame_repr', False)
import numpy as np
import seaborn as sns
import matplotlib.pyplot as plt
%matplotlib inline
import warnings
warnings.simplefilter('ignore')

df = pd.io.parsers.read_csv('https://raw.githubusercontent.com/mguideng/flavorsofcacao/master/data/raw_df.csv')
df.info()
<class 'pandas.core.frame.DataFrame'>
RangeIndex: 1937 entries, 0 to 1936
Data columns (total 9 columns):
Company (Maker-if known)            1937 non-null object
Specific Bean Origin or Bar Name    1937 non-null object
REF                                 1937 non-null int64
Review Date                         1937 non-null int64
Cocoa Percent                       1937 non-null object
Company Location                    1937 non-null object
Rating                              1937 non-null float64
Bean Type                           924 non-null object
Broad Bean Origin                   1865 non-null object
dtypes: float64(1), int64(2), object(6)
memory usage: 136.3+ KB
It’s a small size consisting of 1,937 rows, each representing a unique chocolate bar, and nine columns, of which two have nulls.
Prep: Two columns will be dropped. The first is “Specific Bean Origin or Bar Name”. It’s too varied and is largely duplicated in “Broad Bean Origin”. “REF” will also be dropped. The numbers reference when records were added where higher numbers correspond to more recent entries made to date. It’s basically a time series measure that will be highly correlated to “Review Date.”
df.drop(['Specific Bean Origin or Bar Name', 'REF'], axis = 1, inplace = True)
Lastly, columns will be renamed accordingly for readability:
- Company (Maker-if known) = company
- Company Location = location
- Review Date = year
- Cocoa Percent = cocoa
- Rating = rating
- Bean Type = type
- Broad Bean Origin = origin
newcol = ['company', 'year', 'cocoa', 'location', 'rating', 'type', 'origin']
df = df.rename(columns = dict(zip(df.columns, newcol)))
Here’s a glimpse of what we’ll be working with:
print(df.head(10))
    company  year cocoa location  rating     type            origin
0  A. Morin  2012   70%   France    3.50      NaN           Bolivia
1  A. Morin  2012   63%   France    3.75      NaN              Peru
2  A. Morin  2013   70%   France    3.25      NaN            Brazil
3  A. Morin  2013   70%   France    3.00      NaN             Burma
4  A. Morin  2013   70%   France    2.75      NaN          Colombia
5  A. Morin  2013   70%   France    3.75      NaN           Ecuador
6  A. Morin  2013   70%   France    3.00  Criollo        Madagascar
7  A. Morin  2013   70%   France    2.75      NaN            Panama
8  A. Morin  2013   70%   France    3.25      NaN  Papua New Guinea
9  A. Morin  2013   63%   France    4.00      NaN              Peru
Rating
The ratings column will be the first to cover. In getting the distribution of rating scores, the first thing I notice is there is not a single 5 rating. How is this possible with nearly 2,000 entries? I’m guessing any 5 ratings were excluded for some reason because its absence entirely is pretty hard to believe. Well, at least for a sucker like me. I’d probably end up rating most a 5.
plt.subplots(figsize = [10, 4])
sns.countplot(df['rating'], color = '#7C7C7C')
plt.title('Ratings Distribution')
Text(0.5,1,'Ratings Distribution')
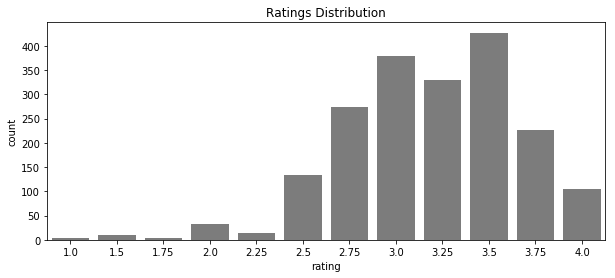
Summary stats are shown below. The average rating is 3.2, intrepreted to be “satisfactory” by this group. A standard deviation of just 0.5 captures a narrow range (2.70 and 3.70) between the min (1.0) and max (4.0) where scores are clustered closely to the average.
print(df['rating'].describe())
count    1937.000000
mean        3.189081
std         0.467534
min         1.000000
25%         3.000000
50%         3.250000
75%         3.500000
max         4.000000
Name: rating, dtype: float64
Prep: There’s no clean up, but while we’re here, we’ll go ahead and create an additional column called “rating_set” that we’ll use in Part Two. It will be our target variable, where a rating of 3.75 or higher will take on a value of 1 and a 0 otherwise.
Then we can get a count of those rated at 3.75 (“praiseworthy”) or higher. At just 331 total, the dataset is considered unbalanced since highly-rated chocolates make up just 17 percent of the total.
df['rating_set'] = np.where(df['rating'] >= 3.75, 1, 0)
print(df['rating_set'].value_counts())
0    1606
1     331
Name: rating_set, dtype: int64
Company Name
For this column, we’ll start by getting a list of all names for the companies that manfuctured the chocolates. There’s clearly a wide array of them. But where’s the well-loved Hershey Foods Corporation? You won’t find it here since the focus is on “fine craft” chocolates. Actually, it’s likely we won’t recognize a majority of these companies. Most mass market chocolates we’re familiar with do not entirely manufacture their own chocolates, a process known as “bean-to-bar”. Referred to as chocolate “melters” — rather than “makers” — they purchase chocolate in bulk then flavor, mold, package, and market the finished products. There are also chocolate makers who produce chocolates exclusively for other companies (and not directly to consumers) under “private labels”. It’s also possible that most on this list are artisan chocolate companies that specialize in small-batch production and do not export widely.
print (df['company'].sort_values().unique())
['A. Morin' 'AMMA' 'Acalli' 'Adi aka Fijiana (Easy In Ltd)'
 'Aequare (Gianduja)' 'Ah Cacao' "Akesson's (Pralus)" 'Alain Ducasse'
 'Alexandre' 'Altus aka Cao Artisan' 'Amano' 'Amatller (Simon Coll)'
 'Amazing Cacao' 'Amazona' 'Ambrosia' 'Amedei' 'Anahata' 'Animas' 'Ara'
 'Arete' 'Artisan du Chocolat' 'Artisan du Chocolat (Casa Luker)'
 'Askinosie' 'Auro' 'Bahen & Co.' 'Bakau' 'Bar Au Chocolat' "Baravelli's"
 'Batch' 'Beau Cacao' 'Beehive' 'Belcolade' 'Bellflower' 'Belyzium'
 'Benoit Nihant' 'Bernachon' 'Beschle (Felchlin)' 'Bisou' 'Bitacora'
 'Bittersweet Origins' 'Black Mountain' 'Black River (A. Morin)'
 'Blanxart' 'Blue Bandana' 'Boho' 'Bonnat' 'Bouga Cacao (Tulicorp)'
 'Bowler Man' "Brasstown aka It's Chocolate" 'Brazen' 'Breeze Mill'
 'Bright' 'Britarev' 'Bronx Grrl Chocolate' 'Bullion' 'Burnt Fork Bend'
 'C-Amaro' 'Cacao Arabuco' 'Cacao Atlanta' 'Cacao Barry' 'Cacao Hunters'
 'Cacao Market' 'Cacao Prieto' 'Cacao Sampaka' 'Cacao Store'
 'Cacao de Origen' 'Cacaodada' 'Cacaosuyo (Theobroma Inversiones)'
 'Cacaoyere (Ecuatoriana)' 'Callebaut' 'Cao' 'Caoni (Tulicorp)'
 'Captain Pembleton' 'Caribeans' 'Carlotta Chocolat' 'Castronovo' 'Cello'
 'Cemoi' 'Chaleur B' 'Chapon' 'Charm School' 'Chchukululu (Tulicorp)'
 'Chequessett' 'Chloe Chocolat' 'Chocablog' 'Choco Del Sol' 'Choco Dong'
 'ChocoReko' "Chocola'te" 'Chocolarder' 'Chocolate Alchemist-Philly'
 'Chocolate Con Amor' 'Chocolate Conspiracy' 'Chocolate Makers'
 'Chocolate Tree, The' 'Chocolats Privilege' 'Chocolibrium' 'Chocosol'
 'Chocovic' 'Chocovivo' 'Choklat' 'Chokolat Elot (Girard)' 'Choocsol'
 'Christopher Morel (Felchlin)' 'Chuao Chocolatier'
 'Chuao Chocolatier (Pralus)' 'Claudio Corallo' 'Cloudforest'
 'Coleman & Davis' 'Compania de Chocolate (Salgado)' 'Condor' 'Confluence'
 'Coppeneur' "Cote d' Or (Kraft)" 'Cravve' 'Creo' 'DAR' 'Daintree'
 'Dalloway' 'Damson' 'Dandelion' 'Danta' 'Dark Forest' 'Davis' 'De Mendes'
 'De Villiers' 'DeVries' 'Dean and Deluca (Belcolade)'
 'Debauve & Gallais (Michel Cluizel)' 'Desbarres' 'Dick Taylor'
 'Doble & Bignall' 'Dole (Guittard)' 'Dolfin (Belcolade)' 'Domori'
 'Dormouse' "Duffy's" 'Dulcinea' 'Durand' 'Durci' 'ENNA'
 'East Van Roasters' 'Eau de Rose' 'Eclat (Felchlin)' 'Edelmond'
 'El Ceibo' 'El Rey' 'Emerald Estate' "Emily's"
 'Enric Rovira (Claudio Corallo)' 'Erithaj (A. Morin)' 'Escazu'
 "Ethel's Artisan (Mars)" 'Ethereal' 'Fearless (AMMA)' 'Feitoria Cacao'
 'Felchlin' 'Finca' 'Forever Cacao' 'Forteza (Cortes)' 'Fossa'
 'Franceschi' 'Frederic Blondeel' 'French Broad' 'Fresco' 'Fresh Coast'
 'Fresh Coast aka Just Good Choc.' 'Friis Holm' 'Friis Holm (Bonnat)'
 'Fruition' 'Garden Island' 'Georgia Ramon' 'Glennmade' 'Gonzales'
 'Goodnow Farms' 'Grand Place' "Green & Black's (ICAM)"
 'Green Bean to Bar' 'Grenada Chocolate Co.' 'Guido Castagna' 'Guittard'
 'Habitual' 'Hachez' 'Hacienda El Castillo' 'Haigh' 'Harper Macaw'
 'Heilemann' 'Heirloom Cacao Preservation (Brasstown)'
 'Heirloom Cacao Preservation (Fruition)'
 'Heirloom Cacao Preservation (Guittard)'
 'Heirloom Cacao Preservation (Manoa)'
 'Heirloom Cacao Preservation (Millcreek)'
 'Heirloom Cacao Preservation (Mindo)'
 'Heirloom Cacao Preservation (Zokoko)' 'Hogarth' 'Hoja Verde (Tulicorp)'
 'Holy Cacao' 'Honest' 'Hotel Chocolat' 'Hotel Chocolat (Coppeneur)'
 'Hummingbird' 'INDI' 'Idilio (Felchlin)' 'Indah' 'Indaphoria' 'Indi'
 'Isidro' 'Izard' 'Jacque Torres' 'Johnny Iuzzini' 'Jordis' "K'ul"
 'Kah Kow' 'Kakao' 'Kallari (Ecuatoriana)' 'Kaoka (Cemoi)' 'Kerchner'
 "Ki' Xocolatl" 'Kiskadee' 'Krak' 'Kto' 'Kyya' "L'Amourette"
 'L.A. Burdick (Felchlin)' 'La Chocolaterie Nanairo'
 'La Maison du Chocolat (Valrhona)' 'La Oroquidea' 'La Pepa de Oro'
 'Laia aka Chat-Noir' 'Lajedo do Ouro' 'Lake Champlain (Callebaut)' 'Land'
 'Landmark (Amano)' 'Letterpress' 'Levy' 'Lilla' 'Lillie Belle'
 'Lindt & Sprungli' 'Loiza' 'Lonohana' 'Love Bar' 'Luisa Abram' 'Luker'
 'Machu Picchu Trading Co.' 'Madecasse (Cinagra)' 'Madre' 'Maglio'
 'Majani' 'Malagasy (Chocolaterie Robert)' 'Malagos'
 'Malie Kai (Guittard)' 'Malmo' 'Mana' 'Manifesto Cacao' 'Manoa'
 'Manufaktura Czekolady' 'Map' 'Map Chocolate' 'Marana'
 "Marigold's Finest" 'Marou' 'Mars' 'Marsatta' 'Martin Mayer'
 'Mast Brothers' 'Matale' 'Maverick' 'Mayacama' 'Meadowlands'
 'Menakao (aka Cinagra)' 'Mesocacao' 'Metiisto' 'Metropolitan'
 'Michel Cluizel' 'Middlebury' 'Millcreek Cacao Roasters' 'Mindo'
 'Minimal' 'Mirzam' 'Mission' 'Mita' 'Moho' 'Molucca' 'Momotombo'
 'Monarque' 'Monsieur Truffe' 'Montecristi' 'Muchomas (Mesocacao)'
 'Mutari' 'Nahua' 'Naive' 'Nanea' 'Nathan Miller' 'Na�ve' 'Nearynogs'
 'Neuhaus (Callebaut)' 'Nibble' 'Night Owl' 'Noble Bean aka Jerjobo'
 "Noir d' Ebine" 'Nova Monda' 'Nuance' 'Nugali' 'Oakland Chocolate Co.'
 'Obolo' 'Ocelot' 'Ocho' 'Ohiyo' 'Oialla by Bojessen (Malmo)'
 'Olive and Sinclair' 'Olivia' 'Omanhene' 'Omnom'
 'Original Beans (Felchlin)' 'Original Hawaiin Chocolate Factory'
 'Orquidea' 'Pacari' 'Palette de Bine' 'Pangea' 'Park 75' 'Parliament'
 'Pascha' 'Patric' 'Paul Young' 'Peppalo' 'Pierre Marcolini' 'Pinellas'
 'Pitch Dark' 'Pomm (aka Dead Dog)' 'Potomac' 'Pralus'
 'Pump Street Bakery' 'Pura Delizia' 'Q Chocolate' 'Quetzalli (Wolter)'
 'Raaka' 'Rain Republic' 'Rancho San Jacinto' 'Ranger' 'Raoul Boulanger'
 'Raw Cocoa' 'Republica del Cacao (aka Confecta)' 'Ritual' 'River-Sea'
 'Roasting Masters' 'Robert (aka Chocolaterie Robert)'
 'Rococo (Grenada Chocolate Co.)' 'Rogue' 'Rozsavolgyi' 'Ruket' 'S.A.I.D.'
 'SRSLY' 'Sacred' 'Salgado' 'San Jose' 'Santander (Compania Nacional)'
 'Santome' 'Scharffen Berger' 'Seaforth' 'Shark Mountain' "Shark's"
 'Shattell' 'Sibu' 'Sibu Sura' 'Silvio Bessone' 'Sirene' 'Sjolinds'
 'Smooth Chocolator, The' 'Snake & Butterfly' 'Soklet' 'Sol Cacao'
 'Solkiki' 'Solomons Gold' 'Solstice' 'Soma' 'Somerville' 'Soul'
 'Spagnvola' 'Spencer' 'Sprungli (Felchlin)' 'StRita Supreme' 'Starchild'
 'Stella (aka Bernrain)' 'Stone Grindz' 'Sublime Origins' 'Summerbird'
 'Suruca Chocolate' 'Svenska Kakaobolaget' 'Szanto Tibor' 'TCHO' 'Tabal'
 'Tablette (aka Vanillabeans)' 'Tan Ban Skrati' 'Taza' 'Tejas' 'Terroir'
 'The Barn' 'Theo' 'Theobroma' 'Timo A. Meyer' "To'ak (Ecuatoriana)"
 'Tobago Estate (Pralus)' 'Tocoti' 'Tosier' 'Treehouse' 'Tsara (Cinagra)'
 'Two Ravens' 'Un Dimanche A Paris' 'Uncouth' 'Undone' 'Upchurch' 'Urzi'
 'Uto Pick' 'Valrhona' 'Vanleer (Barry Callebaut)'
 'Vao Vao (Chocolaterie Robert)' 'Vicuna' 'Videri' 'Vietcacao (A. Morin)'
 'Vintage Plantations' 'Vintage Plantations (Tulicorp)' 'Violet Sky'
 'Vivra' 'Wellington Chocolate Factory' 'White Label' 'Whittakers'
 "Wilkie's Organic" "Willie's Cacao" 'Wm' 'Woodblock' 'Xocolat' 'Xocolla'
 "Zak's" 'Zart Pralinen' 'Zokoko' 'Zoto (Chocolatoa)' 'Zotter'
 'hello cocoa' 'hexx' 'iQ Chocolate' 'organicfair'
 'twenty-four blackbirds']
Do you recognize any from your local stores? I’ve seen some on this list sold in grocery and specialty stores such as Chuao Chocolatier, Guittard, Lindt & Sprungli, Mars, TCHO, Theo, and Valrhona.
Prep: A few fixes can be made using regular expressions. For one, there are other various instances of company names enclosed in parenthesis. Recall that the column was originally called “Company (Maker-if known)” and this implies the dataset includes companies that are “makers” and/or “melters”. Take the company name “Erithaj (A. Morin)” for instance. A. Morin is a maker, already listed as a company on its own. So rather than treating it as a unique separate company, we’ll just extract names in any parenthesis to focus on the makers as much as possible. Also, any puncutation and whitespace throughout will be stripped.
df['company'] = df.company.str.replace(r'[^(]*\(|\)[^)]*', '')
df['company'] = df['company'].str.replace('Na�ve','Naive')
df['company'] = df['company'].str.replace('[^\w\s]','')
df['company'] = df['company'].str.replace('  ','')
After some cleanup, the final tally is nearly 400 unique companies. Who are the top 20 that produced the most? Soma tops the list, having produced 50 of the nearly 2,000 chocolates. This is unusually high, since in comparison, the median number of chocolates produced per company is just three. Looking into the company, Soma doesn’t actually sell many plain bars. They do, however, offer scheduled public and private tasting events, and “carry on a variety of chocolate experiments” in their “Cacao Bean Lab” where “tinkering is an everyday affair.” This may explain how so many of their chocolates ended up in the dataset.
print('Total Companies:', df['company'].nunique(), '\n----------\nChocolates per Company - Top 20:')
print(df['company'].value_counts().head(20), '\n----------')
print('Median Chocolates per Company:', df.groupby('company')['company'].count().median())
Total Companies: 396
----------
Chocolates per Company - Top 20:
Soma                     50
Felchlin                 43
Bonnat                   39
Coppeneur                38
Valrhona                 32
Pralus                   30
Fresco                   29
Guittard                 29
Arete                    29
A Morin                  28
Domori                   23
Zotter                   19
Tulicorp                 19
Mast Brothers            18
Dandelion                17
Scharffen Berger         17
Smooth Chocolator The    17
Artisan du Chocolat      16
Rogue                    16
Dick Taylor              15
Name: company, dtype: int64
----------
Median Chocolates per Company: 3.0
Let’s zero in on the highly-rated chocolate bars. Not surprisingly, a majority of the top 20 companies who produced most of the highly rated chocolates were also those who produced the most chocolates period. Notable exceptions include:
- Amano
- Brasstown aka Its Chocolate
- Duffys
- Michel Cluizel
- Pierre Marcolini
- Sirene
- Terroir
Duly noted!
print('High-Quality Chocolates per Company - Top 20:')
print(df.query('rating_set == 1').groupby('company')['company'].count().sort_values(ascending = False).head(20))
High-Quality Chocolates per Company - Top 20:
company
Soma                           24
Felchlin                       16
Bonnat                         12
Arete                          10
Domori                          9
Valrhona                        9
Smooth Chocolator The           8
A Morin                         7
Fresco                          7
Rogue                           7
Scharffen Berger                7
Duffys                          6
Brasstown aka Its Chocolate     6
Pralus                          6
Pierre Marcolini                6
Michel Cluizel                  5
Sirene                          5
Terroir                         5
Amano                           5
Guittard                        4
Name: company, dtype: int64
Company Location
I’m guessing this column refers to the country from which a company originated, is headquartered, or where manufacturing sites are located considering that a company can correspond to more than one country. All looks clean and no data prep is needed. Here’s a list of all 59 of them.
print('Total Company Locations:', df['location'].nunique(), '\n----------')
print (df['location'].sort_values().unique())
Total Company Locations: 59
----------
['Amsterdam' 'Argentina' 'Australia' 'Austria' 'Belgium' 'Bolivia'
 'Brazil' 'Canada' 'Chile' 'Colombia' 'Costa Rica' 'Czech Republic'
 'Denmark' 'Dominican Republic' 'Ecuador' 'Fiji' 'Finland' 'France'
 'Germany' 'Ghana' 'Grenada' 'Guatemala' 'Honduras' 'Hungary' 'Iceland'
 'India' 'Ireland' 'Israel' 'Italy' 'Japan' 'Lithuania' 'Madagascar'
 'Martinique' 'Mexico' 'Netherlands' 'New Zealand' 'Nicaragua' 'Peru'
 'Philippines' 'Poland' 'Portugal' 'Puerto Rico' 'Russia' 'Sao Tome'
 'Scotland' 'Singapore' 'South Africa' 'South Korea' 'Spain' 'St. Lucia'
 'Suriname' 'Sweden' 'Switzerland' 'U.A.E.' 'U.K.' 'U.S.A.' 'Venezuela'
 'Vietnam' 'Wales']
In terms of frequency, clearly, most of the tastings have been for domestic chocolates with the United States accounting for 819 of the total chocolates. There’s quite a bit of Western European countries too, also known to be major producers of chocolate worldwide.
print('Company Locations - Top 15:')
print(df['location'].value_counts().head(15))
Company Locations - Top 15:
U.S.A.         819
France         159
Canada         135
U.K.           110
Italy           73
Ecuador         56
Australia       50
Belgium         43
Germany         39
Switzerland     38
Austria         28
Venezuela       26
Spain           26
Colombia        23
Hungary         23
Name: location, dtype: int64
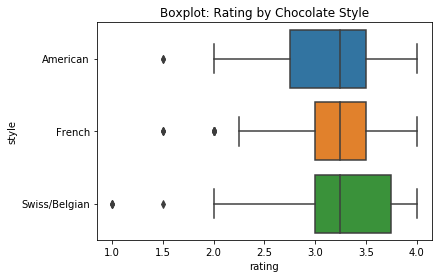
What might be interesting to consider is the “style” of chocolate making in certain countries. It goes without saying that not all chocolate in a country is made in the specific style it is known for. Also, there’s a ton of nuances in the production processes that distinguish the different styles that I just don’t know (especially when it comes to chocolate confections like truffles and pralines with fillings). That said, we can still generalize on what’s commonly known about their flavors. For one, we all know that Switzerland is world-renowned for their sweet and milky chocolates. This lighter style is adapted from the Belgian style, which in general contains less sugar and more cocoa. In comparison, the French style, also common in Spanish and Italian chocolates, is known for being very rich and more bitter. The American style is considered to be overall much sweeter with forward flavor notes that over-empower the taste of the chocolate itself (maple and bacon, anyone?); however this has been changing due to influences from European chocolatiers and evidenced by the growing popularity of plain dark chocolate varieties.
When considering the ratings for all three styles, the median rating score is the same for all three at 3.25. The French style scores consistently a bit better than the Belgian/Swiss styles (less deviation), but the Belgian/Swiss style captures higher ratings (including 3.75 in its upper quartile). Between these two, it looks like a toss up. Regardless, what actually matters is whatever you like! I personally prefer sweet with a bold dark coffee flavor. That sounds more like the American style. How about you, what’s your preference?
sty = df[['location', 'rating']]
sty = sty[sty['location'].str.contains('Switzerland|Belgium|France|Spain|Italy|U.S.A')]
dict_sty = {'Switzerland':'Swiss/Belgian',
                  'Belgium':'Swiss/Belgian',
                  'France':'French',
                  'Spain':'French',
                  'Italy':'French',
                  'U.S.A.':'American'}
sty['style'] = sty['location'].map(dict_sty)

plt.figure(figsize = (6, 4))
p = sty[['style', 'rating']].sort_values('style', ascending = True)
sns.boxplot(x = 'rating', y = 'style', data = p)
plt.title('Boxplot: Rating by Chocolate Style')
Text(0.5,1,'Boxplot: Rating by Chocolate Style')
Bean Origin
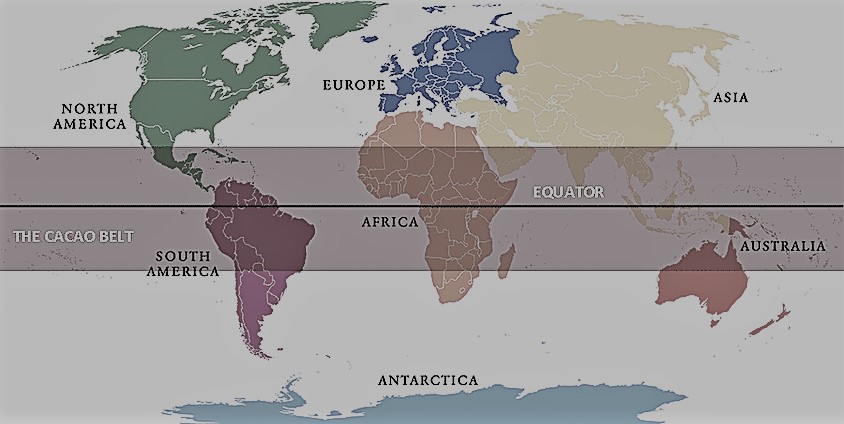
The cacao tree that chocolate is made from is said to be native to South America’s upper Amazon region, specifically in what’s now Ecuador. Today, cacao is grown throughout the world in warm, wet climates that extend about 20 degrees north and south of the equator, known as “the cacao belt”
In the data, origin is defined on a broad country level:
print (df['origin'].sort_values().unique())
['Africa, Carribean, C. Am.' 'Australia' 'Belize' 'Blend' 'Bolivia'
 'Brazil' 'Burma' 'Cameroon' 'Carribean' 'Carribean(DR/Jam/Tri)'
 'Central and S. America' 'Colombia' 'Colombia, Ecuador' 'Congo'
 'Cost Rica, Ven' 'Costa Rica' 'Cuba' 'DR, Ecuador, Peru'
 'Dom. Rep., Madagascar' 'Dominican Rep., Bali' 'Dominican Republic'
 'Ecuador' 'Ecuador, Costa Rica' 'Ecuador, Mad., PNG' 'El Salvador' 'Fiji'
 'Gabon' 'Ghana' 'Ghana & Madagascar' 'Ghana, Domin. Rep'
 'Ghana, Panama, Ecuador' 'Gre., PNG, Haw., Haiti, Mad' 'Grenada'
 'Guat., D.R., Peru, Mad., PNG' 'Guatemala' 'Haiti' 'Hawaii' 'Honduras'
 'India' 'Indonesia' 'Indonesia, Ghana' 'Ivory Coast' 'Jamaica' 'Liberia'
 'Mad., Java, PNG' 'Madagascar' 'Madagascar & Ecuador' 'Malaysia'
 'Martinique' 'Mexico' 'Nicaragua' 'Nicaragua, Madagascar' 'Nigeria'
 'PNG, Vanuatu, Mad' 'Panama' 'Papua New Guinea' 'Peru'
 'Peru(SMartin,Pangoa,nacional)' 'Peru, Belize' 'Peru, Dom. Rep'
 'Peru, Ecuador' 'Peru, Ecuador, Venezuela' 'Peru, Mad., Dom. Rep.'
 'Peru, Madagascar' 'Philippines' 'Principe' 'Puerto Rico' 'Samoa'
 'Sao Tome' 'Sao Tome & Principe' 'Solomon Islands' 'South America'
 'South America, Africa' 'Sri Lanka' 'St. Lucia' 'Suriname' 'Tanzania'
 'Tobago' 'Togo' 'Trinidad' 'Trinidad, Ecuador' 'Trinidad, Tobago'
 'Trinidad-Tobago' 'Uganda' 'Vanuatu' 'Ven, Bolivia, D.R.'
 'Ven, Trinidad, Ecuador' 'Ven., Indonesia, Ecuad.' 'Ven., Trinidad, Mad.'
 'Ven.,Ecu.,Peru,Nic.' 'Venez,Africa,Brasil,Peru,Mex' 'Venezuela'
 'Venezuela, Carribean' 'Venezuela, Dom. Rep.' 'Venezuela, Ghana'
 'Venezuela, Java' 'Venezuela, Trinidad' 'Venezuela/ Ghana' 'Vietnam'
 'West Africa' 'blend' nan]
Prep: There’s a few things we can do to clean this one up. Those having multiple countries are identified as having certain puncutations and words, such as ‘&’ and ‘blend’. They will be replaced as “multiple” and collectively treated as its own category. Otherwise, there would be single-instances that would just add noise to the model. Also, nulls will be set to “not specified”.
df.loc[df['origin'].str.contains(',|&|and|/|-|Blend|blend|South America|West Africa', na = False), 'origin'] = '(multiple)'
df['origin'].fillna('(not specified)', inplace = True)
There. The total number of origin countries total 53. The most common origins are shown to be in the Latin countries of Venezuela, Ecuador, Peru, and the Dominican Republic.
Overall, the countries can be clustered into the three regions of The Americas, Asias & Oceanias, and The Africas. Most commercially grown beans come from The Africas (the Ivory Coast in particular), accounting for two-thirds of the world crop.
print('Total Origin Countries:', df['origin'].nunique(), '\n----------\nOrigin Countries - Top 10:')
print(df['origin'].value_counts().head(10))
Total Origin Countries: 53
----------
Origin Countries - Top 10:
Venezuela             225
Ecuador               199
Peru                  177
Dominican Republic    175
Madagascar            150
(multiple)             83
(not specified)        72
Nicaragua              68
Bolivia                66
Brazil                 62
Name: origin, dtype: int64
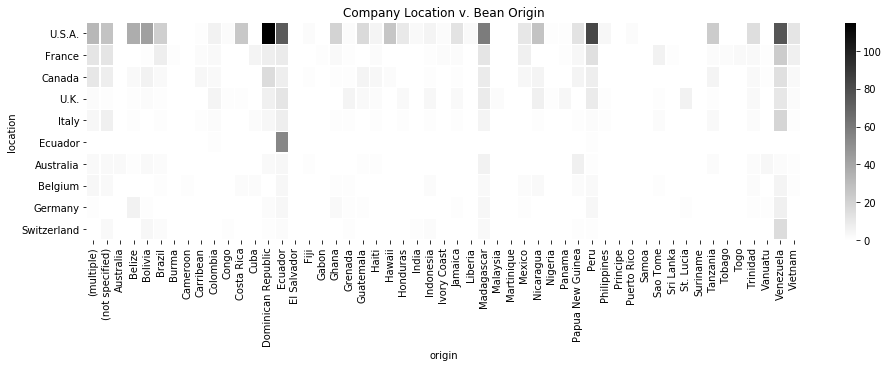
We’ve got two country-level columns (location v. origin) and cross-tabbing them shows an interesting pattern in our data: with the exception of Ecuador, none of the other major producers of chocolate (primarily U.S.A and Western Europe) are major cacao-producing countries. Whereas most artisinal foods tend to be made close to where the ingrediants are sourced from, fine gourmet chocolates are typically produced far from its origin sources.
matrix = pd.crosstab(df['location'], df['origin'])
matrix['tot'] = matrix.sum(axis = 1)
matrix = matrix.sort_values('tot', ascending = False)
matrix = matrix.drop('tot', axis = 1)

plt.subplots(figsize = [16, 4])
sns.heatmap(matrix.head(10), linewidths = .2, cmap ='binary')
plt.title('Company Location v. Bean Origin')
Text(0.5,1,'Company Location v. Bean Origin')
Bean Type
What kind of cacao bean types do we have here?
print (df['type'].sort_values().unique())
['Amazon' 'Amazon mix' 'Amazon, ICS' 'Beniano' 'Blend'
 'Blend-Forastero,Criollo' 'CCN51' 'Criollo' 'Criollo (Amarru)'
 'Criollo (Ocumare 61)' 'Criollo (Ocumare 67)' 'Criollo (Ocumare 77)'
 'Criollo (Ocumare)' 'Criollo (Porcelana)' 'Criollo (Wild)' 'Criollo, +'
 'Criollo, Forastero' 'Criollo, Trinitario' 'EET' 'Forastero'
 'Forastero (Amelonado)' 'Forastero (Arriba)' 'Forastero (Arriba) ASS'
 'Forastero (Arriba) ASSS' 'Forastero (Catongo)' 'Forastero (Nacional)'
 'Forastero (Parazinho)' 'Forastero(Arriba, CCN)' 'Forastero, Trinitario'
 'Matina' 'Nacional' 'Nacional (Arriba)' 'Trinitario'
 'Trinitario (85% Criollo)' 'Trinitario (Amelonado)'
 'Trinitario (Scavina)' 'Trinitario, Criollo' 'Trinitario, Forastero'
 'Trinitario, Nacional' 'Trinitario, TCGA' 'blend' nan]
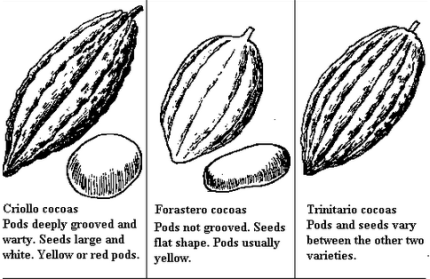
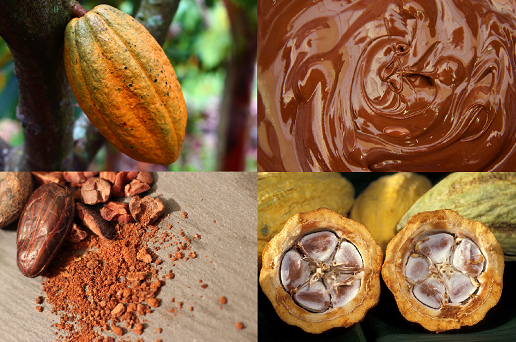
There’s a lot of variation, so let’s make some sense of it. To begin with, chocolate is made from the tree Theobroma, which translates to “Food of the Gods.” There are about 20 species of Theobroma but just one is harvested heavily to make chocolates: the Theobroma Cacao. The seeds in the Theo C.’s pods are the cacao beans. There are three main varietals of this tree: Forastero, Criollo, and Trinitario.
Forastero makes up the majority of cacao crops and are considered to be bulk beans used in commercial production. Criollo trees are recognized as producing the highest-quality beans with the finest flavor, however are very delicate and particularly difficult to grow. As such, only a very small amount of Criollo are havested each year. Then there’s Trinatario, bred from both the Forastero and Criollo trees. As an in-between, it has the refined taste of the Criollo and the hardiness of the Forastero.
Blending is common to control costs, especially with the versitile Forastero bean, however chocolate makers do choose to mix different varieties of cacao to achieve certain flavor profiles. The term “single-origin”, as opposed to a blend, is commonly used to indicate that a chocolate is made from a single bean variety from a single country (an estate or harvest even), however the strict definition about what this means exactly is cloudy at best. So we won’t go there, however, if you do want to know more about single-origins, check out this article from thechocolatejournalist.com (which is a great source by the way if you want to learn more about chocolates overall).
Hybrids of different varieties occur frequently, both naturally from cross pollination (like the Criollo Ocumare in Venezuala) and through man-made genome assembly (e.g., the CCN , EET, and Matina bean types in our dataset).
Prep: We’ll work with what we now know to transform the bean types into one of six categories: either a main type (i.e., ‘Forastero’, ‘Criollo’, ‘Trinitario’), a ‘blend’, a ‘hybrid’, or ‘not specified’ in instances where there are nulls.
If you recall, most of this column was mostly null. There’s common ways of dealing with nulls, including imputing them with the average or deleting rows that contain the nulls entirely. It is up to our best judgement to decide, and in this case, I’ve set them to ‘not specified’ for several reasons. First, imputing with an average doesn’t make sense since it is categorical with no ordinal importance or continuous value. Also, we’re already dealing with a small datset and deleting the rows would reduce it by half. Lastly, setting it to ‘not specified’ is acceptable in that it would be treated as a category of its own that is considered information.
We’ll create a dictionary and index match it to the dataframe by creating a new column called “varietal” based on these rules:
- Forastero if exact; matches ‘Amazon’; is ‘Beniano’, ‘Nacional’; or ‘Nacional (Arriba)’; or specifies the subspecies ‘Amelonado’, ‘Arriba’, ‘Catongo’, ‘Nacional’, or ‘Parazinho’.
- Criollo if exact; or specifies the subspecies ‘Amarru’, ‘Porcelana’ or ‘Wild’.
- Trinatario if exact; is ‘Trinitario, TCGA’; or specifies the subspecies ‘Amelonado’ or ‘Scavina’.
- blend if matches ‘blend’; or mixes any of the three main varieties.
- hybrid if is ‘Matina’ or EET’; or matches ‘CCN’ or ‘Ocumare’.
- not specified if null.
dict_type = {'Amazon':'Forastero',
                  'Amazon mix':'Forastero',
                  'Amazon, ICS':'Forastero',
                  'Beniano':'Forastero',
                  'Blend':'blend',
                  'Blend-Forastero,Criollo':'blend',
                  'CCN51':'hybrid',
                  'Criollo':'Criollo',
                  'Criollo (Amarru)':'Criollo',
                  'Criollo (Ocumare 61)':'hybrid',
                  'Criollo (Ocumare 67)':'hybrid',
                  'Criollo (Ocumare 77)':'hybrid',
                  'Criollo (Ocumare)':'hybrid',
                  'Criollo (Porcelana)':'Criollo',
                  'Criollo (Wild)':'Criollo',
                  'Criollo, +':'Criollo',
                  'Criollo, Forastero':'blend',
                  'Criollo, Trinitario':'blend',
                  'EET':'hybrid',
                  'Forastero':'Forastero',
                  'Forastero (Amelonado)':'Forastero',
                  'Forastero (Arriba)':'Forastero',
                  'Forastero (Arriba) ASS':'Forastero',
                  'Forastero (Arriba) ASSS':'Forastero',
                  'Forastero (Catongo)':'Forastero',
                  'Forastero (Nacional)':'Forastero',
                  'Forastero (Parazinho)':'Forastero',
                  'Forastero(Arriba, CCN)':'hybrid',
                  'Forastero, Trinitario':'blend',
                  'Matina':'hybrid',
                  'Nacional':'Forastero',
                  'Nacional (Arriba)':'Forastero',
                  'Trinitario':'Trinitario',
                  'Trinitario (85% Criollo)':'blend',
                  'Trinitario (Amelonado)':'Trinitario',
                  'Trinitario (Scavina)':'Trinitario',
                  'Trinitario, Criollo':'blend',
                  'Trinitario, Forastero':'blend',
                  'Trinitario, Nacional':'blend',
                  'Trinitario, TCGA':'Trinitario',
                  'blend':'blend'}
df['varietal'] = df['type'].map(dict_type)
df['varietal'].fillna('not specified', inplace = True)
The distribution of bean varietals are much more clearer now. From what is known, chocolates made exclusively with the Trinitario variety are the most common. At 22 percent, it accounts for at least double that of Forastero (11 percent) and Criollo (9 percent).
print('Relative Frequency of Bean Varietals:')
print(df['varietal'].value_counts(normalize = True))
Relative Frequency of Bean Varietals:
not specified    0.522974
Trinitario       0.222509
Forastero        0.106866
Criollo          0.087765
blend            0.053175
hybrid           0.006711
Name: varietal, dtype: float64
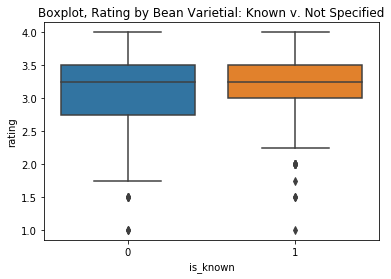
It isn’t that surprising that over half of the varietals were not specified; it’s not very often we actually see the the bean type(s) printed on the chocolate labels anyway. Let’s make use of this fact to see how ratings for varietals compare when they are known versus not being specified. The result? Known varietals rate higher than the mysterious ones.
v = df[['varietal', 'rating']]
def describe_var(x):
    if x == 'not specified':
        return 0
    else:
        return 1
v['is_known'] = v['varietal'].apply(describe_var)

plt.figure(figsize = (6, 4))
sns.boxplot(x = 'is_known', y ='rating', data = v)
plt.title('Boxplot, Rating by Bean Varietial: Known v. Not Specified')
Text(0.5,1,'Boxplot, Rating by Bean Varietial: Known v. Not Specified')
Cocoa Percentage
Have you ever wondered about the difference between the use of “cacao” versus “cocoa”? Is it a result of a typo from long ago that’s pervaded to confuse us? Or is there an actual disctinction between the two? If it’s the latter, maybe the distincturn turns somewhere between the harvesting of the “cacao” bean and the production of the “cocoa” liquor ingredient for chocolates:
Either way, it’s interchangable in our everyday languauge and what’s important in understanding cocoa percentage, which is often prominently displayed on chocolate bar labels, is the cocoa liquor (not to be confused with chocolates with alcoholic liqour). The defintition on Wikipedia sums it up well:
“Chocolate liquor (cocoa liquor) is pure cocoa mass in solid or semi-solid form. Like the cocoa beans (nibs) from which it is produced, it contains both cocoa solids and cocoa butter in roughly equal proportion.
It is produced from cocoa beans that have been fermented, dried, roasted, and separated from their skins. The beans are ground into cocoa mass (cocoa paste). The mass is melted to become the liquor, and the liquor is either separated into cocoa solids and cocoa butter, or cooled and molded into blocks of raw chocolate. Its main use (often with additional cocoa butter) is in making chocolate.”
So basically, the percentage is the proportion of the product made from the cocoa liquor (again that’s cocoa solids plus cocoa butter) plus any added cocoa butter. The remainder of the percentage will be the sugar, dairy, an emulsifier like soy leitchen, and vanilla plus any other flavor ingredients. As with all other foods, chocolates manufacturers are required by the U.S. Food and Drug Administration (FDA) to list on its labels the ingredients used in the highest amount first to the lowest order. It’s common for sugar or dairy to be the first ingrediant on the labels, but for higher quality chocolates like those in our dataset, it’s likely that cocoa liquor will be the first.
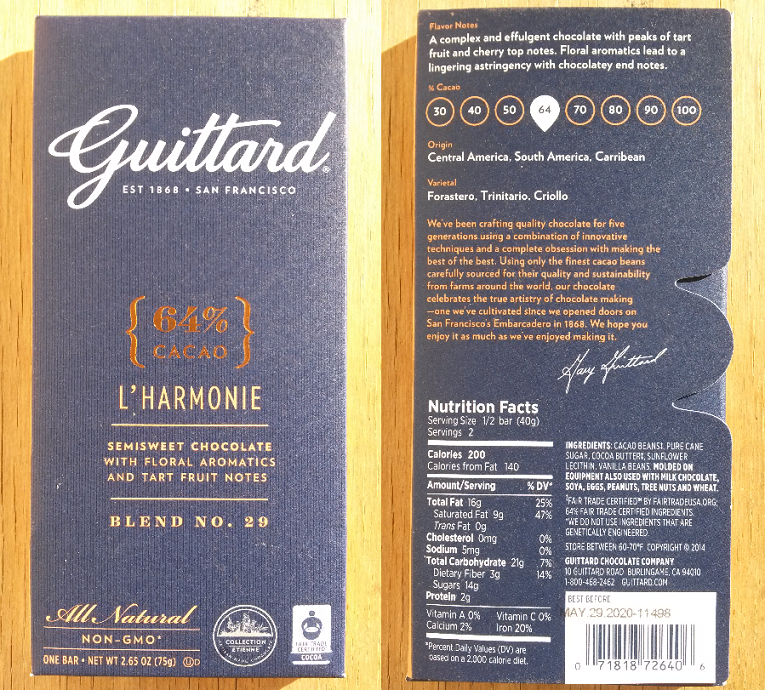
The FDA also sets standards on the minimum amounts of cocoa content (and other ingrediants) required to even be called chocolate. What consumers generally refer to as dark chocolates actually falls in what the FDA defines as “sweet chocolate”. There’s no nomenclature for “dark” chocolate specifically, but to be labeled “semisweet chocolate” or “bittersweet chocolate”, the product must contain at least 35 percent cocoa. From there, it’s up to the manufacturer whether they want to label it “semisweet” or “bittersweet” so long as it contains that 35 percent minimum.
Prep: As we saw earlier, the data type for this column is an object and needs to be converted into a number. Aside from that, all else looks good.
df['cocoa'] = df['cocoa'].str.replace('%','').astype(float) / 100
Looking at the ranges of the cocoa percentage in the dataset, the minimum is at 42 percent and they can all be considered “semisweet chocolate or bittersweet chocolate”. In terms of flavor, the quantity of sugar in a chocolate determines sweetness and the way beans are roasted largely determines the bitterness. There’s even 100 percent here, so with no room for any sugar or dairy, they are sure to be bitter (like the cocoa powder used for making hot chocolate and brownies).
print (df['cocoa'].sort_values().unique())
[0.42  0.46  0.5   0.53  0.55  0.56  0.57  0.58  0.6   0.605 0.61  0.62
 0.63  0.64  0.65  0.66  0.67  0.68  0.69  0.7   0.71  0.715 0.72  0.725
 0.73  0.735 0.74  0.75  0.76  0.77  0.78  0.79  0.8   0.81  0.82  0.83
 0.84  0.85  0.86  0.87  0.88  0.89  0.9   0.91  0.99  1.   ]
As for the most common percentage in the sample, 70 percent chocolates dominate by far, capturing over 38 percent of the total. This is clearly around the “sweet spot” for dark chocolate tastings, and probably for general consumption too, since about 3/4 of them fall in a range that is plus/minus 5 percentage points from the 70 percent cocoa mark.
print('Relative Frequency of Cocoa Percentage - Top 10:')
print(df['cocoa'].value_counts(normalize = True).head(10))
Relative Frequency of Cocoa Percentage - Top 10:
0.70    0.384615
0.75    0.124935
0.72    0.105318
0.65    0.042850
0.80    0.038203
0.74    0.026846
0.68    0.025813
0.73    0.024264
0.60    0.023232
0.85    0.018585
Name: cocoa, dtype: float64
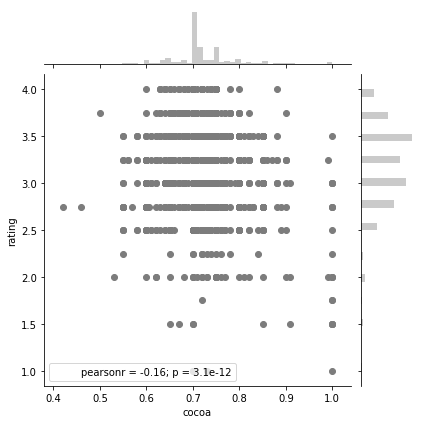
In the plot below, we see that cocoa percentage and ratings have a weak relationship, though it does lean slightly negative where a higher cocoa percentage corresponds to a lower rating.
sns.jointplot(x = 'cocoa', y ='rating', data = df, color = '#7C7C7C')
<seaborn.axisgrid.JointGrid at 0x15a9fd1beb8>
Review Year
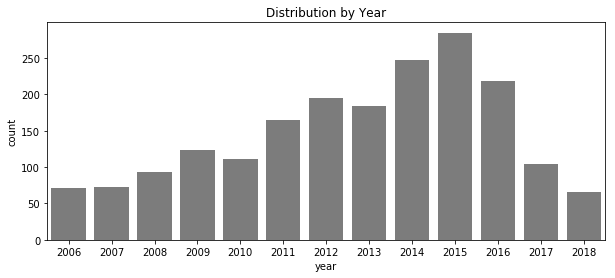
This is the last column in the dataset. The data spans over a 13-year period.
print('Distribution by Year:')
print(df.groupby(['year']).size().reset_index(name = 'count'))
Distribution by Year:
    year  count
0   2006     71
1   2007     73
2   2008     93
3   2009    123
4   2010    111
5   2011    165
6   2012    195
7   2013    184
8   2014    247
9   2015    285
10  2016    219
11  2017    105
12  2018     66
Since 2006, when just 71 chocolate bars were rated, there was an annual upward trend until it peaked at 285 in 2015, but has since dipped significantly when just 105 bars were rated last year (2017). With the current year almost over and only 66 bars rated year-to-date, the 2018 total is looking to be even more sparse than last year’s levels. There’s fluctations, but it’s likely reflective of how active this tasting group has been. Is it possible to run out of chocolates to rate? I guess you can only taste so many chocolates, and the thought of eating over 1,900 of them is pretty astonishing.
plt.subplots(figsize = [10, 4])
sns.countplot(df['year'], color = '#7C7C7C')
plt.title('Distribution by Year')
Text(0.5,1,'Distribution by Year')
The data is somewhat imbalanced by year, but the data itself is clean and this column won’t require any data preparation.
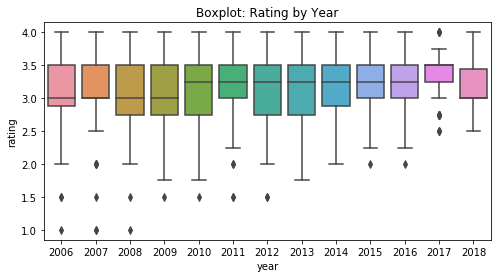
Looking at average ratings, they’ve consistently scored between 3 and 3.5 on an annual basis and appears to have increased slightly over time. A final thing to consider about year is that like wine, the quality from cacao beans can vary from year to year due to seasonal harvesting conditions, thus affecting quality.
plt.figure(figsize = (8, 4))
p = df[['year', 'rating']].sort_values('year', ascending = True)
sns.color_palette("colorblind")
sns.boxplot(x = 'year', y = 'rating', data = p)
plt.title('Boxplot: Rating by Year')
Text(0.5,1,'Boxplot: Rating by Year')
This completes the tasks for learning about the chocolates and preparing the data. At this stage, there’s still plenty of unknowns about data relationships, if any, but we’ve distilled enough about the information to proceed with the last task: developing our machine learning problem framework.
Problem Framework
Machine learning generally solves two types of problems: regression and classification. The former can be the problem of predicting a continuous value output (the rating number will be 3.00, for example) and the latter can be the problem of predicting a discrete class label output (e.g., yes/no on whether the rating is 3.75 or higher).
For our purposes, we’ll convert our regression problem into a classification one because it’s simpler to understand. Based on the information about its features, we’ll predict whether the chocolate is highly-rated. Specifically, ratings in a range between 1 and 5 will be converted into a binary class set:
- Set 0: 1.00 to 3.50
- Set 1: 3.75 to 5.00
In structuring the problem, the framework will be developed around 3 questions:
Q1: What is the problem?
“I want a machine learning system that will tell me which chocolates will receive the high ratings.”
Let’s break this down further:
- Task – Classify a chocolate bar as going to be highly rated (1) or not (0).
- Experience - A database of chocolates where some have been rated high, and others have not.
- Performance - Classification accuracy, shown as the number of chocolates predicted correctly as a percentage of all chocolates, and F1 score, a measure of both accuracy precision (exactness) and recall (completeness).
- Assumptions - Select features such as the country origin of the cacao bean where it was harvested, the type of cacao bean variety that goes into making chocolate, and the percentage of the cocoa ingredient are relevant to the algorithm.
Q2: Why is the problem being solved?
The motivation for solving the problem is to explore a different way in which to learn from data that is different from statistics. As a top-down learning exercise, we won’t necessarily have to use the most suitable algorithm to solve the problem, but instead pick one to explore methods with, get results, learn new skills, and have fun.
Q3: How would I solve the problem?
Considering the data at hand and goals for solving our problem, we would ideally try out multiple algorithms that handle classification (e.g., Decision Trees and Random Forests, Logistic Regressions, Naive Bayes, Nearest Neighbor, Support Vector Machines) to see which perform better and then optimize from there. For the sake of ease, we’ll just stick with one: the conceptually simple yet powerful Decision Tree.
This concludes Part One. Are you craving chocolates yet? In Part Two, we’ll go over Decision Tree modeling then bring the dataset back in for some more processing before we build, train and evaluate the algorithm.
=======
Learning points
-
I didn’t start off in the terminal to “get” Python. I’m using the Anaconda Python distribution to deploy the Spyder (GUI-based) and Jupyter (interactive web-based shell) environments. These seem to work for me, together with getting in the habit of using their keyboard shortcuts early on.
-
In learning how I can use Python to apply this project, I’ve opted to focus on certain libraries and modules such as
NumPyfor numerical array computing,MatplotlibandSeabornfor data visualization,Scikit-learnfor machine learning, and especiallyPandasfor data manipulation on dataframes (and comparing them to the equivalents in R). While I’ve enjoyed this top-down approach to learning, I have yet to actually develop a foundation for the Python language. -
It helped to have a goal to guide this learning project: To create a simple model with quality data. Spending time upfront to clean the data would make things easier later since it will significantly impact the workflow when we fit it to an algorithm. As far as which algorithm model to apply, a basic tree that solves a classification problem seemed to me the simplest to start with.
-
We learned enough about the chocolate and cocoa domain to help decide how the variables would be prepared, and more so, enough to make more informed chocolate purchasing decisions for uh, you know, prediction experiments.
-
The only variables that would seem to matter to a prediction model would be ones related to the properties of the chocolates: the cocoa percent, bean varietal, and bean origin. It’s not much, but it is an assumption we can apply. Actually, the assumptions we make about the data and its domain is largely reflected in how we choose to process it. It varies widely and it’s neat to see how others working with it on Kaggle make assumptions, both explicitly and not, to drive decisions about their models and methods. The kernals by others have also been a useful source of inspiration.
-
It would be a mistake to think of data as being the same as what it is supposed to mean in the anaysis. Remember, the data was generated for a purpose specific to the chocolate tasting group. The reality is, there’s so much more that happens in the production process that affects quality that are not reflected in this dataset. But it would also be a mistake to focus on the limitations of the data we have to work with. If we did, we may not even bother conducting such experiments that are so important to building skillsets, knowledge, and intuition. So forge ahead while staying aware of these limitations and have fun learning along the way!