This post is about applying basic text mining tasks to Glassdoor company reviews to find out what employees write the most about to describe their workplace experiences, and whether they tend to be expressed in a more negative, positive or neutral way. Final results are shown as visuals, both tables and graphs. Developed completely in R, the code can be found in my github.
=======
Ever wondered what it’s like to work for a specific company? If so, you’ve probably looked into Glassdoor. The site contains user-generated content on which people share feedback about company-specific compensation, interview experiences, and post anonymous reviews that evaluate the workplace. Its features include star ratings (on a 5-point scale), where employees award the company stars on a mix of factors such as workplace culture, work/life balance, and senior management.
The star ratings are enough for some people to get an idea of whether the prospective company has the right environment for them, but for others, it doesn’t tell the story about sentiments towards the workplace. Sentiments reflect people’s attitudes and opinions based on what they have to say - whether they are positive, negative, or neutral - and can provide a proxy for employee satisfaction.
It makes sense to want to work at a place where employee satisfaction is high. The more satisfied employees are, the better the attitudes are about their work, and the better their performance will be. This makes a workplace attractive. The reviews section of Glassdoor is a good resource to gauge this, but involves sifting through pages and pages of reviews - some decidedly misleading and exaggerated, others insightful and useful - and it can be a time-consuming endeavor.
An alternative is to streamline this task and get a high-level overview shown primarily as tables and charts. One way to do this is through text mining. The idea is to apply web scraping to the written reviews about a company posted on Glassdoor to create a database of text. After obtaining this data, it can be applied to text analytics and sentiment analysis.
We’ll use the “Big Three” as an example in this post. That’s McKinsey & Co., The Boston Consulting Company and Bain & Co. - widely known as “MBB” - and they’re the world’s largest consulting firms by revenue.
A little bit about MBB: they all focus on strategy consulting at board level and as leaders in their industry, they excel at what they do. The world’s most ambitious and brightest minds in business are attracted to these consultancies. They invest heavily in their people who undergo rigorous core strategy training and engage with Fortune 500 clients. They’re known for providing ongoing opportunities and support for professional advancement even after leaving the firm (i.e., exit opportunities). However, along with these benefits comes the downsides of long hours and travel requirements that tend to upend life outside of work.
Having never worked at a Big Three, my observations about what it’s like to work there are purely subjective. So with that said, let’s check out the results.
PART 1: REVIEWER PROFILE
First, let’s get an overview of the reviewers’ profile in terms of the years that the reviews were posted, as well as the office locations of the MBB firms under review, and the job titles to identify their positions.
The use of peer review sites have grown to a point where today, many consider them to be a generally reliable source of feedback. The growth of Glassdoor is evident here, with MBB employee review contributions growing significantly since the site was created in 2008. To date, nearly 6,500 total reviews have been posted among the three firms.
(Keep in mind that since they all have a different number of reviews, the amount of text we’ll be looking at later will be smaller for BCG and larger for McKinsey and Bain.)
| Year | Freq | Percent |
|---|---|---|
| Bain & Co. - Total Reviews: 2,093 | ||
| 2008 | 39 | 1.9 |
| 2009 | 52 | 2.5 |
| 2010 | 48 | 2.3 |
| 2011 | 59 | 2.8 |
| 2012 | 93 | 4.4 |
| 2013 | 137 | 6.5 |
| 2014 | 175 | 8.4 |
| 2015 | 332 | 15.8 |
| 2016 | 426 | 20.3 |
| 2017 | 423 | 20.2 |
| 2018 | 311 | 14.8 |
| Boston Consulting Group - Total Reviews: 1,687 | ||
| 2008 | 39 | 2.3 |
| 2009 | 54 | 3.2 |
| 2010 | 51 | 3.0 |
| 2011 | 57 | 3.4 |
| 2012 | 94 | 5.6 |
| 2013 | 120 | 7.1 |
| 2014 | 137 | 8.1 |
| 2015 | 244 | 14.5 |
| 2016 | 317 | 18.8 |
| 2017 | 364 | 21.6 |
| 2018 | 211 | 12.5 |
| McKinsey & Co. - Total Reviews: 2,709 | ||
| 2008 | 63 | 2.3 |
| 2009 | 88 | 3.2 |
| 2010 | 138 | 5.1 |
| 2011 | 95 | 3.5 |
| 2012 | 166 | 6.1 |
| 2013 | 196 | 7.2 |
| 2014 | 242 | 8.9 |
| 2015 | 412 | 15.2 |
| 2016 | 490 | 18.1 |
| 2017 | 543 | 20.0 |
| 2018 | 279 | 10.3 |
The locations of reviewers were not given in many instances, but from what is known, offices in New York City, Boston and Chicago are largely represented.
| Location | Freq | Percent |
|---|---|---|
| Bain & Co. | ||
| Not Given | 757 | 36.1 |
| Boston, MA | 186 | 8.9 |
| Chicago, IL | 135 | 6.4 |
| San Francisco, CA | 115 | 5.5 |
| New York, NY | 110 | 5.3 |
| Boston Consulting Group | ||
| Not Given | 847 | 50.2 |
| Boston, MA | 95 | 5.6 |
| New York, NY | 73 | 4.3 |
| Chicago, IL | 54 | 3.2 |
| Gurgaon, Haryana (India) | 51 | 3.0 |
| London, England (UK) | 51 | 3.0 |
| McKinsey & Co. | ||
| Not Given | 1260 | 46.5 |
| New York, NY | 259 | 9.6 |
| London, England (UK) | 94 | 3.5 |
| Chicago, IL | 77 | 2.8 |
| Gurgaon, Haryana (India) | 57 | 2.1 |
| Note: Top 5 based on percent ranking. | ||
A big chunk of position titles were also unknown, but it’s likely that they’re mostly different variations of the functional role of a consultant.
| Position | Freq | Percent |
|---|---|---|
| Bain & Co. | ||
| Anonymous Employee | 855 | 40.8 |
| Consultant | 302 | 14.4 |
| Associate Consultant | 287 | 13.7 |
| Senior Associate Consultant | 137 | 6.5 |
| Manager | 119 | 5.7 |
| Boston Consulting Group | ||
| Anonymous Employee | 825 | 48.9 |
| Consultant | 250 | 14.8 |
| Associate | 114 | 6.8 |
| Project Leader | 97 | 5.7 |
| Principal | 73 | 4.3 |
| McKinsey & Co. | ||
| Anonymous Employee | 1224 | 45.1 |
| Engagement Manager | 233 | 8.6 |
| Associate | 227 | 8.4 |
| Business Analyst | 221 | 8.1 |
| Senior Associate | 59 | 2.2 |
| Note: Top 5 based on percent ranking. | ||
PART 2: STAR RATINGS SECTION
Based on the Glassdoor star ratings, how do MBB employees rate the companies they work for? Pretty high actually. “Overall” ratings between 4 and 5 reflect a workplace where employees are considered “very satisfied.” As a baseline comparison, the average is 3.4 where employees say satisfaction is just “OK” (based on the 700,000 employers reviewed on Glassdoor).
| Firm | Culture | Sr. Mgmt | Work-Life Bal. | Compensation | Career Opp. | Overall |
|---|---|---|---|---|---|---|
| Bain & Co. | 4.8 | 4.5 | 3.6 | 4.7 | 4.7 | 4.7 |
| Boston Consulting Group | 4.3 | 3.9 | 3.1 | 4.4 | 4.3 | 4.3 |
| McKinsey & Co. | 4.3 | 3.8 | 2.7 | 4.2 | 4.3 | 4.2 |
For Bain employees, satisfaction was highest in all factors when compared to others, especially when it comes to the approval of its senior leadership. McKinsey consistently received relatively lower satisfaction marks, and more so for the work-life balance factor. Ratings for BCG were split down the middle between the two others, but shared more similarities with McKinsey employees.
PART 3: COMPANY REVIEWS SECTION
Here’s where the text mining was applied. The company reviews section of Glassdoor shows what employees have to say about the workplace. A review is divided into separate topics about the pros and cons. The pros are the advantages and includes comments around what an employee liked or thought worked well in the company. Conversely, the cons are the disadvantages and reflect what employees disliked or thought needed improvement. Requiring user feedback on both topics helped to make reviews more balanced.
Pros
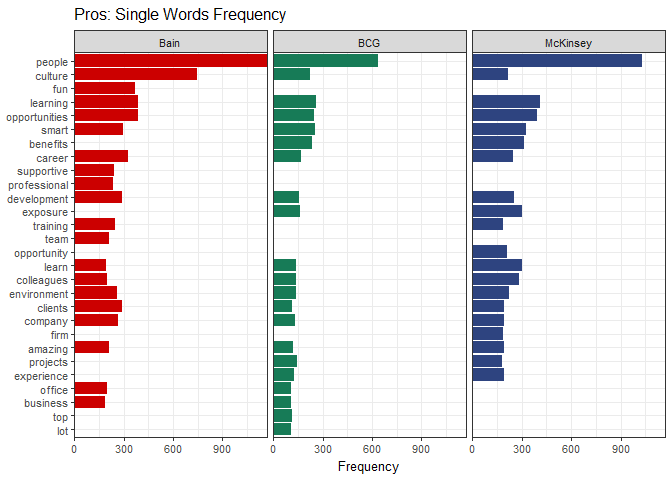
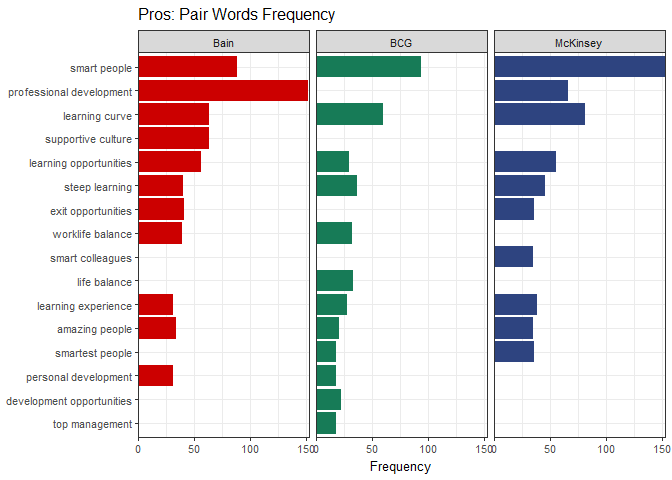
Focusing on just the pros for now, what words are employees using the most to describe their opinions and experiences? The charts below gives us a breakdown of the top words, both singular and pairs (i.e., two words that are used consecutively). For example, “consulting” is a single word, and “consulting firm” are word pairs.
Bain employees describe something as being “fun” much more than McKinsey or BCG employees, with that word making it as one of the top ten used the most. Then there’s “people,” “culture,” and “learning” in which all are used frequently across the firms. But what about these single words? Unless used together with additional words to provide more distinct meanings, the pros of the workplace remain very vague.
Looking at the word pairs below sheds more light about what are considered the greatest aspects about working at a Big Three: working with “smart people”, the opportunities for “professional development,” and the “steep learning” curves. These reflect the importance of knowledge within consultancy. As for the “culture,” Bain employees refer to it as being a “supportive” one. BCG and McKinsey employees have less consensus about the varying words to describe their workplace culture and are not included as among the top pair words.
Some of these words we’ve looked at so far are neutral, such as “people,” “career,” and “team.” We can limit them to those categorized as being either positive (e.g., “fun” and “smart”) or negative (e.g., “hard” and “uncertain”) in sentiment.
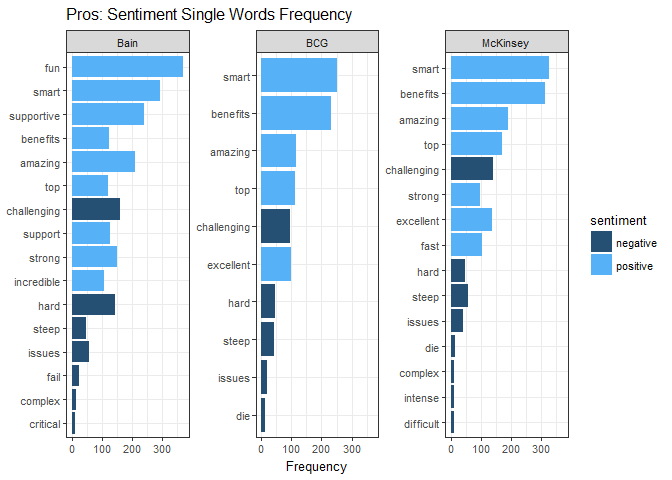
BCG and McKinsey workers are more similar in their use of sentiment expressions, describing their experiences as mostly being “smart” and “amazing” and probably receiving good “benefits” packages. As for workers at Bain, there’s more focus on a “fun” and “supportive” environment. Even the negative words used in the context of the pros like “challenging”, “hard” and “steep” indicates that they enjoy a demanding environment that tests their abilities. Do you interpret it this way as well?
Cons
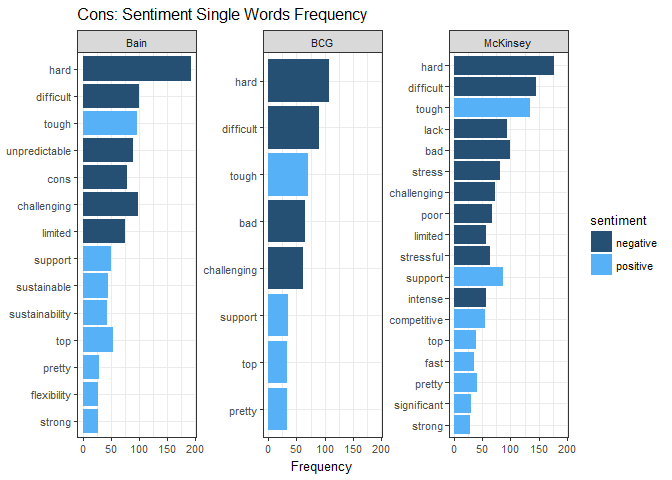
Let’s move on to the cons section, where we’ll examine the same visuals as above. First, the common single words.
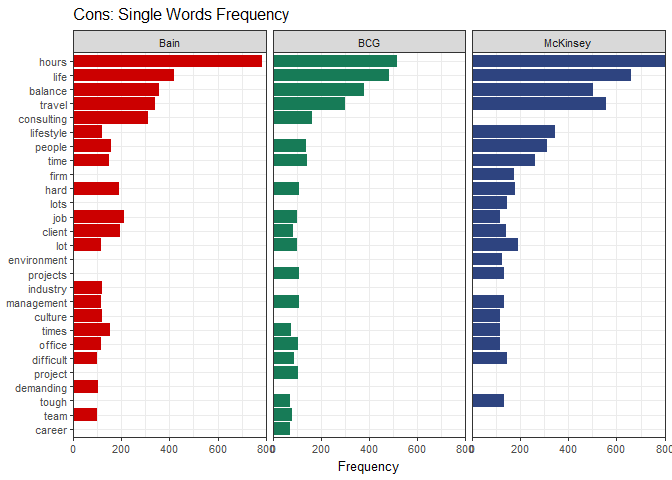
All three firms reference the “hours” as being the most discussed downside of their workplaces, relatively more at Bain since its frequency is double that of the next word. There’s the word “life.” Intuitively it makes sense that it’s used together with another frequent word, “balance,” since after all, context is key and we’re talking about the cons. For consultants, “travel” is thought of negatively, possibly because they have to do it so much which is known to be common in this industry. Also, “client” made it on the list, likely referencing the difficulties of meeting the very high demands of clients that is also common in this industry.
The word pairs below provides some clarification, where indeed some variation of maintaining a good work-life balance is difficult given the hours and travel requirements.
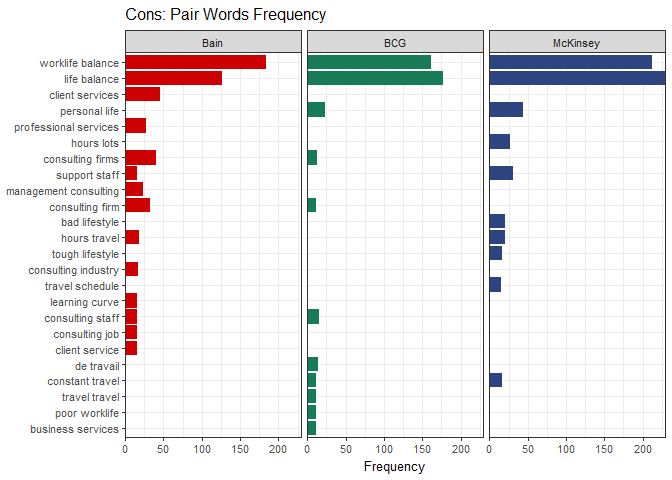
For sentiments, “hard”, “difficult,” and “tough” are synonymous with each other (where “tough” should be considered a negative). Taken together with what we know previously about work-life balance, it’s very likely they’re describing the challenges of maintaining a normal lifestyle.
Sentiment Scoring of Pros & Cons
In this section, let’s consider whether the written reviews as a whole tend to be expressed in a more negative, positive, or neutral light. One way to determine this is by computing a sentiment score for both the pros and cons taken together.
-
For the pros text portions of the reviews: Positive words were given +1 point and negative words were given -1 point.
-
For the cons portion: negative words were assigned -1, however positive words were too. This is because using a positive word to say something negative by negating is significantly more common (e.g., “It’s not good” rather than “It’s bad”).
A net score for each review was derived by summing the +1 and -1 points. It is measured on a polar scale, with a negative value (less than zero) representing a more negative sentiment, and positive value (greater than zero) representing a more positive sentiment. Below shows the distribution of the reviewers’ scores.
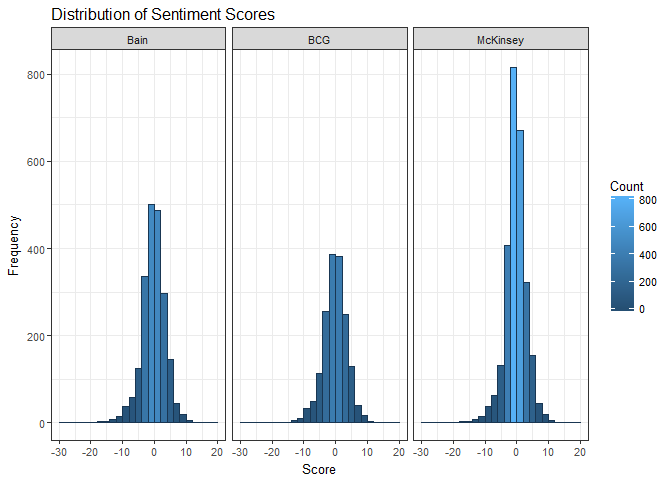
The variability of sentiment scores shows that reviewers at MBB firms tend be quite neutral in the way they express their experiences. With such a high share of neutrally scored content, which I’ll simply interpret as being between -2 and +2, it’s likely that most reviewers are making general statements or statements that carry little sentiment, reflecting a lack of emotionally charged opinions.
| Firm | Min | Qrtl.1 | Median | Mean | Qrtl.3 | Max |
|---|---|---|---|---|---|---|
| Bain | -28 | -2 | 0 | 0.19 | 2 | 15 |
| BCG | -25 | -2 | 0 | 0.22 | 3 | 15 |
| McKinsey | -33 | -1 | 0 | 0.13 | 2 | 15 |
To put this a bit more into perspective, I consider neutral (i.e., scores near zero with little variability) to be pretty good in terms of reflecting satisfaction at the workplace. I’ve applied this sentiment analysis system to various other companies’ reviews and score results tended to skew towards a negative polarity with high variability. A tendency for scores to be on a negative spectrum would actually be expected as normal for most employers given what we know about the prevalence of negativity bias common in review platforms (e.g., people are more motivated to write a review when they have a complaint, more words are used to describe negative experiences versus positive ones, etc.).
Lastly, the panel charts below show how the scores have changed over time at each of the three firms. A score for each review is represented by a single blue-shaded bar. It begins with the first review in 2008 and ends with the last review posted to date. Note that each chart is on a free-scale for Reviewer ID (on the x-axis) and each firm has a different number of total reviews; this makes it easier to see patterns within each individual chart however they are harder to compare across charts.
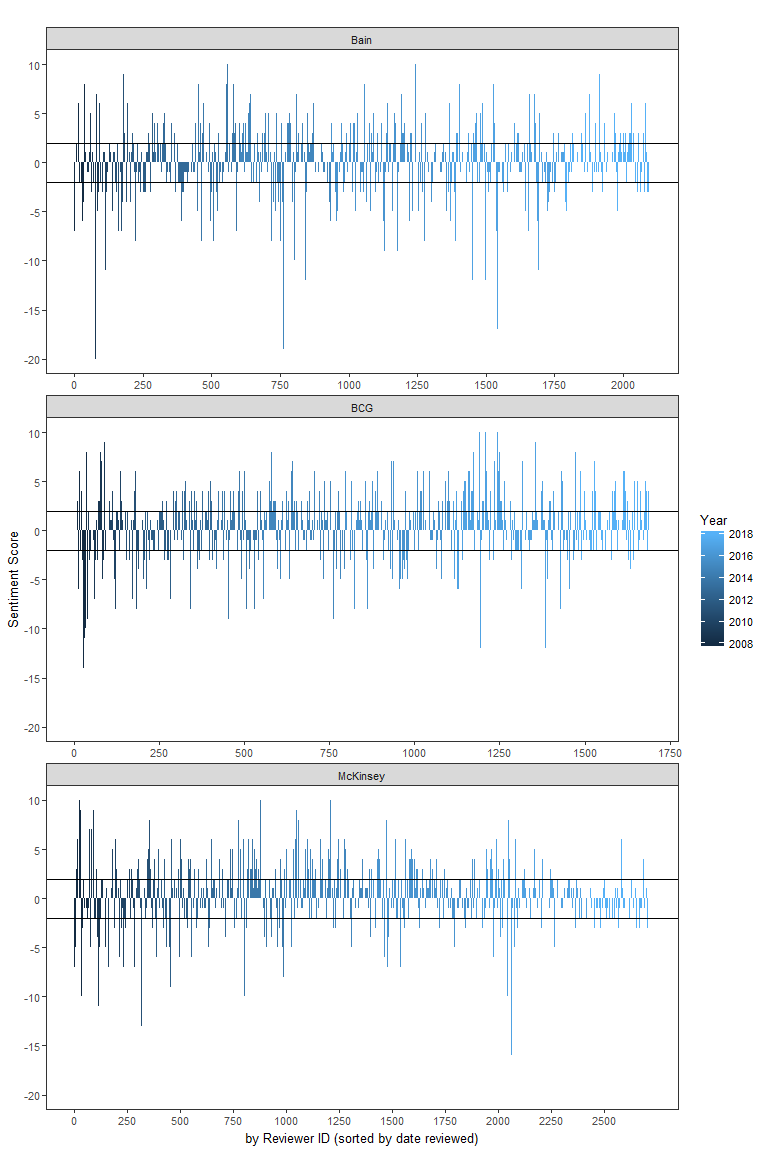
Again, for our purposes, a review is considered neutral if the score falls between -2 and +2. Notice any patterns? Indeed we do see that the distribution of sentiment among reviewers are around near 0 and neutral, especially for McKinsey reviewers in the past few years.
Another way of viewing the scores over time is by the annual averages for the three firms. In the chart below, it may appear that there are fluctuations, but it’s actually subtle changes considering they’re within a close fit range (-1.5 to +1.5). Also, it wasn’t until around 2013/2014 that there were enough reviews on an annual basis to provide a more robust corpus body of text to run text analyses on. We’re just past half of this year, so the score is incomplete for 2018.
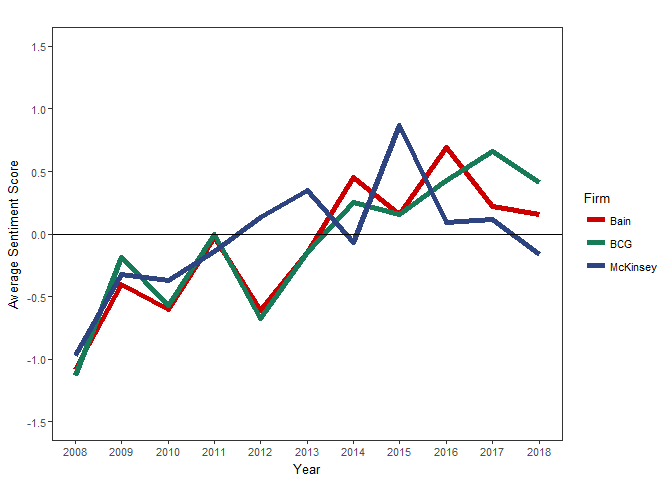
The stars are considered a reliable measure of satisfaction as is, but text analysis gives us an additional piece of the picture that can help us better understand what it’s like to work at a particular employer. Given these considerations, sentiments as a proxy for satisfaction among MBB workers over the past ten years have been overall consistently positive.
Final Remarks
Of course, I’m trying to make things simple here and nothing is really that simple. When creating a sentiment analysis system, pre-processing the text and validating the methodology are crucial steps that can dramatically affect results. A solid sentiment test gets complex, so while this method doesn’t fully capture the true sentiments of these reviews, it’s a quick way to obtain general sentiments for my purposes. It’s based on a decent sample size, the language is clean, there’s consistency in format and content, and the contextual subject matter is understood. Also, it helped significantly that the reviews were already clustered by pros and cons topics to provide perspective. A simple recall test was done, where I ran 20 reviews each of ones I deemed positive, negative, and neutral in advance and the results were sensical.
Additionally, there are some nuances that could be considered in the real world. For example, offices within the same firms at different locations are likely to have their own unique environments. There were also a few reviews I saw that were not written in the English language and should have been translated. I’m interested in getting the bigger picture, and I kept things simple for practicality.
So I’ll leave you to consider these results and encourage you to look into the many resources online where you can leverage text mining and sentiment analysis methods for yourself, perhaps even exploring the application of machine learning techniques. However, keep in mind the many limitations of applying computational methods when trying to uncover complex social phenomena that occurs in natural human language such as sarcasm, humor, persuasion, and so forth.
=======
Learning points
- Learning process included basic exploration and analysis of text to identify patterns, keywords, and other attributes in the data to extract relevant information and then structure the text to derive insights.
- Demonstrated web scraping, text analytics, and sentiment analysis on word-level using tidy data principles and using a binary lexicon to classify sentiment words.
- Packages used: tidytext, tidyverse (includes: dplyr, ggplot2, stringr, tidyr), rvest, purr and kableExtra.
- Inspired by this post from Julia Silge, co-creator of the tidytext package.